Diabetes – Type II Autologous Adipose Stem Cell Therapy
Presented at: 6th World Congress on Anti-Aging Medicine, Paris 2008.
Title: Stem cells in cosmetic medicine and surgery.
Authors: Florencio Q. Lucero1,2, Emerita A. Barrenechea3, Leticia Lucero-Palma1, Kribah Krishnan1, Bill Paspaliaris1
1 Actistem Ltd, Hong Kong
2 Manila Doctors Hospital, Manila
3 St Lukes Hospital, Manila
Presenter: Florencio Q. Lucero
Abstract:
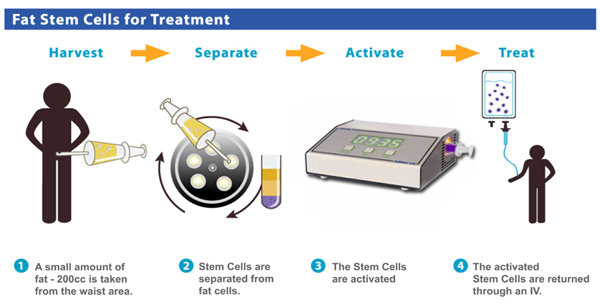
Stem cell therapies hold great promise for anti-aging benefits as they are regenerative in nature. Autologous adipose-derived stem cell transplants hold even more potential as they have no ethical barriers and require no out-of-surgery culture requirements. We have devised a method that entails the isolation of stem cells from fat derived from a mini-liposuction procedure, their activation from a quiescent stage to an active stage, and their reintroduction back into the patient via intravenous mode. This method has now been performed on 167 subjects over a two year period with no adverse effect. The anti-aging benefits that have been observed and reported include increased energy level, vigor, stamina and desire for physical activity, improved short-term memory and powers of attention and concentration, better moods, improvement in sleeping patterns, enhanced sexual function and potency, better appetite and improved digestion, improved hearing and eyesight, improved skin vitality, hair thickness and blackening. Benefits were also observed on a variety of degenerative disease types; however, they were on a small sample number. A clinical trial was then performed to assess the efficacy of the therapy on 37 patients with type II diabetes mellitus. An initial follow up of these patients after three months post-operation has shown a significant and sustained reduction in fasting glucose levels (from 10.36+4.39 mmol/l to 7.11+2.07 mmol/l; p=0.005), and glycosylated haemoglobin (from 9.12+1.90{99bf78f0f9778281ad05ced5995f1fccf0c60e88939fe5298c3a25dc92a04653} to 7.55+0.91{99bf78f0f9778281ad05ced5995f1fccf0c60e88939fe5298c3a25dc92a04653}; p=0.0003), and triglycerides (from 2.09+0.87 to 1.43+0.81; p=0.0003). There was no change in C-peptide levels, total cholesterols and other CBC, LFT and KFT values. The results of the trial to date suggest that the autologous adipose derived stem cell therapy appears to help type II diabetes patients by decreasing their resistance to insulin and decreasing their overall cardiovascular risk factors. We believe that the stem cell transplant is probably acting by positively affecting the autonomic nervous system in these subjects but this is yet to be proven. Most patients noticed the anti-aging benefits reported above and an improvement in their neuropathy.
APPENDIX 3 – blood results for diabetes and adipose stem cell treatmentSafety and efficacy of autologous adipose derived stem cell therapy in Type II diabetes mellitus; 1 year post operative results.Table 1. Baseline Characteristics of Patients
Table 5.2A. Assessment of Laboratory Results at Different Observation Periods Type II
Laboratory/Observation Period
Mean
Sd
p-value
Hemoglobin
Baseline
140.06
14.23
0.626
3 months(n=32)
139.41
14.87
NS
Baseline
140.06
14.23
0.905
6 months (n=32)
139.88
16.24
NS
Baseline
140.03
14.46
0.225
9 months (n=31)
138.48
16.14
NS
Baseline
138.48
13.59
0.236
12 months (n=29)
136.38
15.03
NS
Hematocrit
Baseline
0.41
0.04
0.214
3 months(n=32)
0.42
0.04
NS
Baseline
0.41
0.04
0.005
6 months (n=32)
0.42
0.04
**
Baseline
0.41
0.04
0.000
9 months (n=31)
0.43
0.04
***
Baseline
0.41
0.04
0.315
12 months (n=29)
0.41
0.04
NS
RBC
Baseline
4.69
0.53
0.274
3 months(n=32)
4.74
0.60
NS
Baseline
4.69
0.53
0.020
6 months (n=32)
4.81
0.58
*
Baseline
4.70
0.53
0.007
9 months (n=31)
4.83
0.61
**
Baseline
4.65
0.51
0.338
12 months (n=29)
4.71
0.50
NS
WBC
Baseline
7.70
2.08
0.873
3 months(n=32)
7.64
1.69
NS
Baseline
7.70
2.08
0.539
6 months (n=32)
7.51
1.61
NS
Baseline
7.72
2.11
0.938
9 months (n=31)
7.69
2.20
NS
Baseline
7.59
2.11
0.940
12 months (n=29)
7.62
1.57
NS
UN
Baseline
4.96
1.49
0.418
3 months(n=32)
5.19
1.58
NS
Baseline
4.96
1.49
0.559
6 months (n=32)
5.09
1.74
NS
Baseline
4.89
1.45
0.642
9 months (n=31)
5.02
2.03
NS
Baseline
4.93
1.49
0.089
12 months (n=29)
5.32
1.75
NS
Table 5.2B. Assessment of Laboratory Results at Different Observation Periods Type II (continued)
Laboratory/Observation Period
Mean
Sd
p-value
Creatinine
Baseline
75.16
20.75
0.052
3 months(n=32)
71.31
25.88
NS
Baseline
75.16
20.75
0.531
6 months (n=32)
73.72
23.82
NS
Baseline
73.90
19.82
0.695
9 months (n=31)
74.64
24.26
NS
Baseline
72.55
19.29
0.221
12 months (n=29)
75.00
22.86
NS
Cholesterol
Baseline
5.27
1.26
0.85
3 months(n=32)
5.11
1.19
NS
Baseline
5.27
1.26
0.090
6 months (n=32)
4.94
1.24
**
Baseline
5.23
1.25
0.919
9 months (n=31)
5.20
1.30
***
Baseline
5.21
1.29
0.913
12 months (n=29)
5.25
1.72
NS
Triglyceride
Baseline
2.23
1.51
0.032
3 months(n=32)
1.85
1.59
*
Baseline
2.23
1.51
0.359
6 months (n=32)
1.96
1.30
NS
Baseline
2.26
1.53
0.128
9 months (n=31)
2.02
1.22
NS
Baseline
2.29
1.56
0.088
12 months (n=29)
1.83
1.04
NS
SGPT
Baseline
48.81
17.64
0.350
3 months(n=32)
52.31
27.44
NS
Baseline
48.81
17.64
0.351
6 months (n=32)
52.28
28.56
NS
Baseline
49.29
17.72
0.337
9 months (n=31)
53.03
27.28
NS
Baseline
49.86
18.19
0.747
12 months (n=29)
50.93
22.29
NS
SGOT
Baseline
23.34
8.43
0.106
3 months(n=32)
25.84
10.91
NS
Baseline
23.34
8.43
0.068
6 months (n=32)
26.34
12.46
NS
Baseline
23.61
8.43
0.759
9 months (n=31)
24.39
15.72
NS
Baseline
23.59
8.69
0.837
12 months (n=29)
23.21
10.03
NS
Statistical Results:
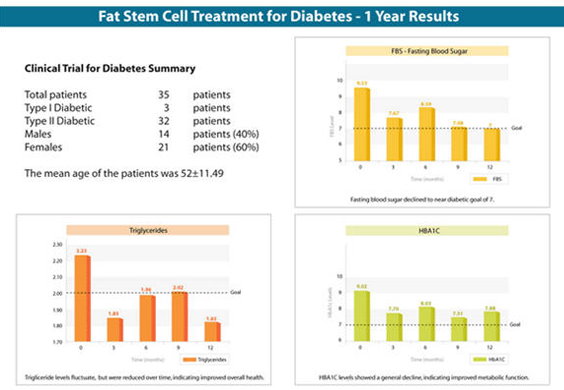
There were 35 patients included in the analysis, 3 of whom where Type I and 32 Type II. The mean age of the sample was 52±11.49 with 14 (40{99bf78f0f9778281ad05ced5995f1fccf0c60e88939fe5298c3a25dc92a04653}) males and 21 (60{99bf78f0f9778281ad05ced5995f1fccf0c60e88939fe5298c3a25dc92a04653}) females. The details of the baseline characteristics of the Type II diabetes patients are shown in Table 1.
Due to the very small number (n=3) of type I diabetes patients, no test of significance was applied to the data (not included). Type II group, Table 2.2, showed significant decrease in FBS all observation periods except on the 6th month wherein there was observable decrease but was not statistically significant.
The Type II group showed statistically significant decrease in all observation periods as shown in Tables 3.2.
Significant decrease was observed on the 3rd and 9th month of the Type II group in C peptide values, while an increase was observed on the 6th and 12th month but not statistically significant, Table 4.2.
In Type II group, significant increase in RBC at 6th and 9th month were observed, Table 5.2A, while significant decrease in Triglyceride on month 3, Table 5.2B.
Statistical Tests:
Paired t-test was used to determine the mean change in from baseline to follow-up months. McNemar test was used to test the change in urine laboratory results. A p≤0.050 was considered significant.

 APPENDIX 3 – blood results for diabetes and adipose stem cell treatment
Safety and efficacy of autologous adipose derived stem cell therapy in Type II diabetes mellitus; 1 year post operative results.
Table 1. Baseline Characteristics of Patients
APPENDIX 3 – blood results for diabetes and adipose stem cell treatment
Safety and efficacy of autologous adipose derived stem cell therapy in Type II diabetes mellitus; 1 year post operative results.
Table 1. Baseline Characteristics of Patients
 Statistical Results:
There were 35 patients included in the analysis, 3 of whom where Type I and 32 Type II. The mean age of the sample was 52±11.49 with 14 (40{99bf78f0f9778281ad05ced5995f1fccf0c60e88939fe5298c3a25dc92a04653}) males and 21 (60{99bf78f0f9778281ad05ced5995f1fccf0c60e88939fe5298c3a25dc92a04653}) females. The details of the baseline characteristics of the Type II diabetes patients are shown in Table 1.
Due to the very small number (n=3) of type I diabetes patients, no test of significance was applied to the data (not included). Type II group, Table 2.2, showed significant decrease in FBS all observation periods except on the 6th month wherein there was observable decrease but was not statistically significant.
The Type II group showed statistically significant decrease in all observation periods as shown in Tables 3.2.
Significant decrease was observed on the 3rd and 9th month of the Type II group in C peptide values, while an increase was observed on the 6th and 12th month but not statistically significant, Table 4.2.
In Type II group, significant increase in RBC at 6th and 9th month were observed, Table 5.2A, while significant decrease in Triglyceride on month 3, Table 5.2B.
Statistical Tests:
Paired t-test was used to determine the mean change in from baseline to follow-up months. McNemar test was used to test the change in urine laboratory results. A p≤0.050 was considered significant.
Statistical Results:
There were 35 patients included in the analysis, 3 of whom where Type I and 32 Type II. The mean age of the sample was 52±11.49 with 14 (40{99bf78f0f9778281ad05ced5995f1fccf0c60e88939fe5298c3a25dc92a04653}) males and 21 (60{99bf78f0f9778281ad05ced5995f1fccf0c60e88939fe5298c3a25dc92a04653}) females. The details of the baseline characteristics of the Type II diabetes patients are shown in Table 1.
Due to the very small number (n=3) of type I diabetes patients, no test of significance was applied to the data (not included). Type II group, Table 2.2, showed significant decrease in FBS all observation periods except on the 6th month wherein there was observable decrease but was not statistically significant.
The Type II group showed statistically significant decrease in all observation periods as shown in Tables 3.2.
Significant decrease was observed on the 3rd and 9th month of the Type II group in C peptide values, while an increase was observed on the 6th and 12th month but not statistically significant, Table 4.2.
In Type II group, significant increase in RBC at 6th and 9th month were observed, Table 5.2A, while significant decrease in Triglyceride on month 3, Table 5.2B.
Statistical Tests:
Paired t-test was used to determine the mean change in from baseline to follow-up months. McNemar test was used to test the change in urine laboratory results. A p≤0.050 was considered significant.
Recent Comments